What is Volume Profile (Explained in Detail)?
To put it simply, volume profile is a distribution graphic that displays the accumulation of volume at price.
This basic 1-sentence description might not sound all that “exciting” or “fascinating”. But, in my opinion, volume profile is one of the best (if not THE best) trading tools/indicators available. It’s drastically underutilized amongst the retail crowd.
For some reason, volume profile isn’t typically part of the “conventional” group of technical analysis indicators that new traders tend to discover and utilize at the start – like moving averages, RSI, MACD, Bollinger bands, Fibonacci lines, etc.
This is because a lot of trading platforms consider volume & market profile “advanced” tools, which makes them seem intimidating. And on top of that, most platforms either 1) don’t offer profiling functionality for free, or 2) don’t offer it at all.
As a result, volume profile often gets overlooked by beginners in place of inferior tools. But I think this is a big mistake. I’m not saying conventional technical indicators (like the ones mentioned above) are ineffective. But they’re all secondary to profiling.
Volume profile organizes and displays market participation in a powerful way that no other tool can. It provides a pure, unadulterated view of critical market-generated information. No other tool/indicator is as good at exposing the “quality” of price.
What is Volume Profile Analysis (Composites, Imprints, etc.)?
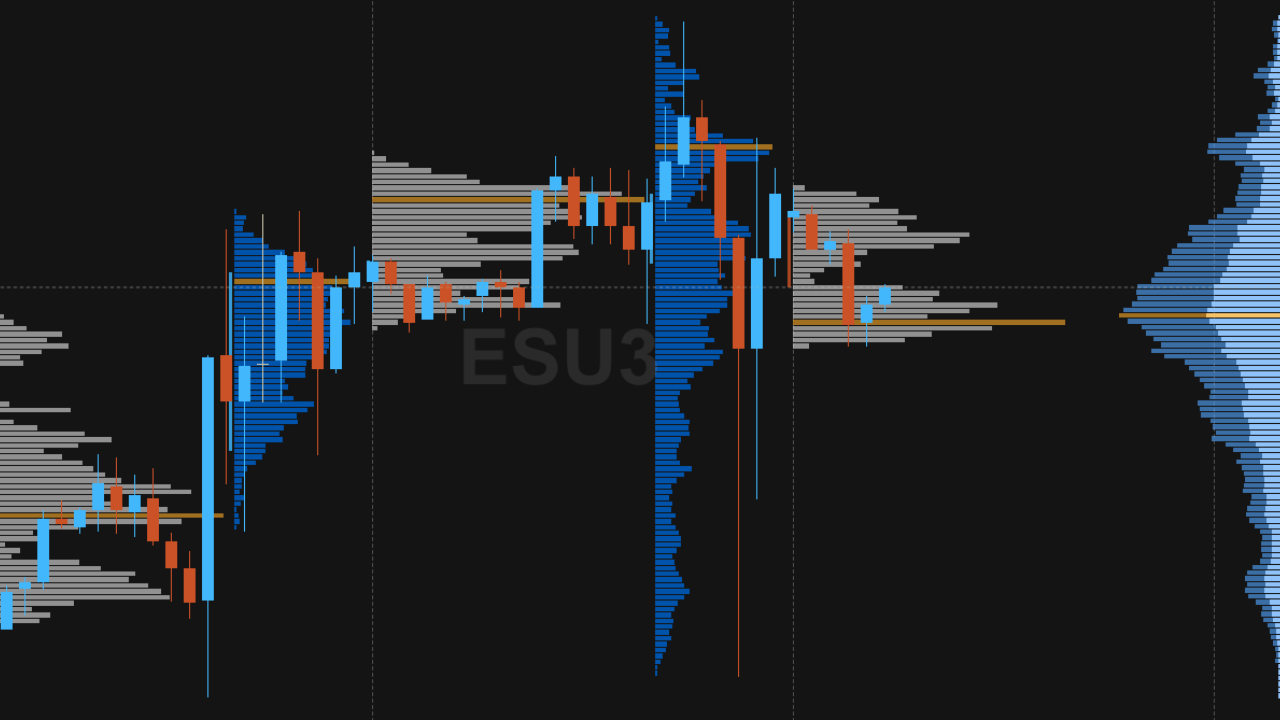
The “default” when people talk about volume profile is often the daily volume profile. In other words, the developing histogram or distribution curve of volume at price for one specific day/session. But there’s a lot more that volume profile can be used to view.
DAILY VOLUME PROFILE EXAMPLE |
|
It’s an extremely robust tool that can be utilized across multiple timeframes to gain valuable insights and pinpoint key levels of interest/participation (low volume nodes, high volume nodes, points of control, value areas, and more).
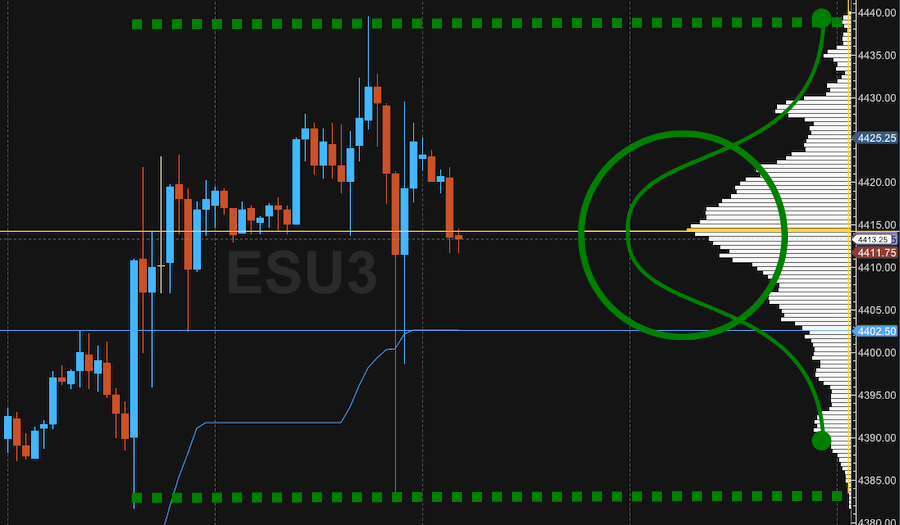
For example, composite volume profiles can be used to combine multiple trading days/sessions together in order to view market participation from a weekly, monthly, quarterly, and yearly perspective. These provide a wider lens of context.
COMPOSITE VOLUME PROFILE EXAMPLE |
|
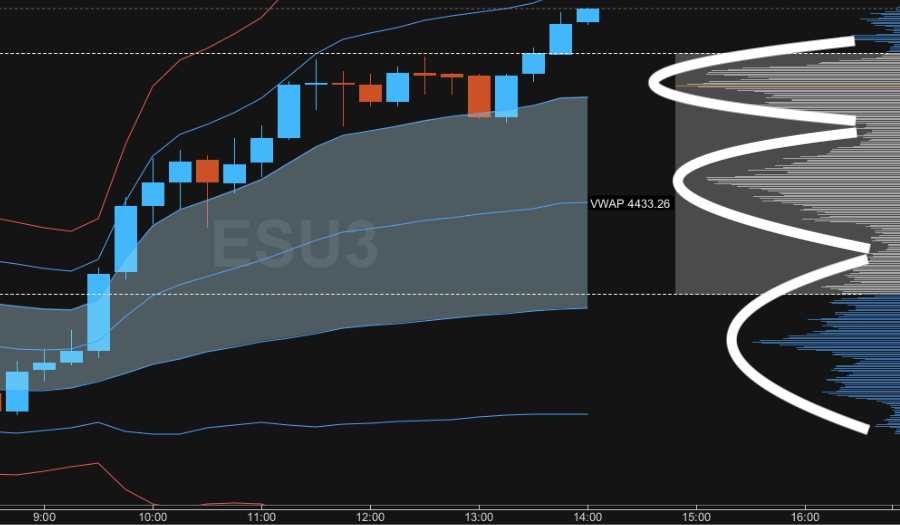
On the flip side of that, volume profiles can also be displayed on lower timeframes (less than 1 day/session), like 4hr, 1 hr, 30min, 5min, 1min, 30sec, etc. (the options are essentially limitless). These are often referred to as volume imprints.
MICRO TIMEFRAME VOLUME IMPRINT EXAMPLE |
|
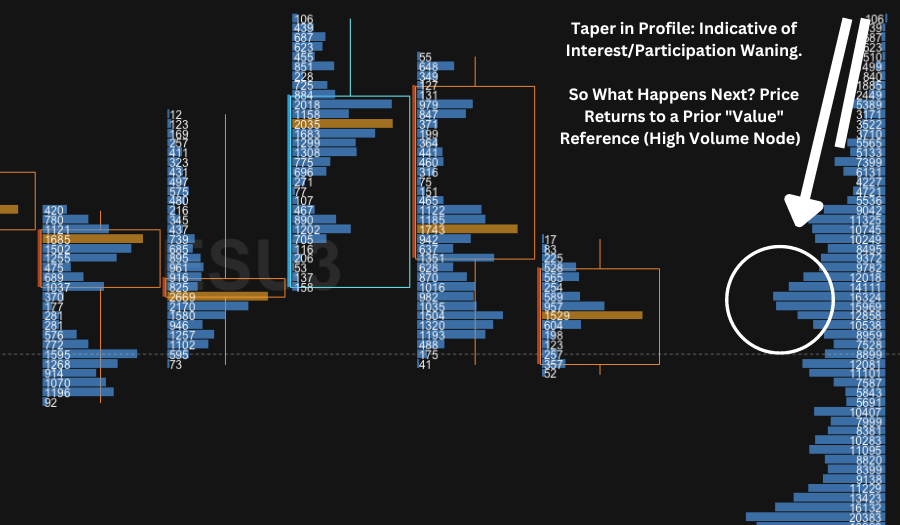
Even though you might not be all that familiar with profiling terminology just yet – the important thing to understand is that being able to view volume (aka interest/participation) at specific prices on multiple timeframes is an incredibly powerful thing.
It shows you where market participants are interested in doing business (aka building “value”) and where they are not.
Volume Profile Trading Systems/Methodologies & Training Programs:
Volume profiling is certainly an extremely powerful tool. But it’s not a magic formula (and nothing is in trading, by the way). So properly applying it through a strong overall system/methodology requires legitimate training/skill development.
The problem that often arises amongst beginner-level traders is that they want to turn every trading tool/indicator into an extremely basic “buy here, sell here” type of system. But this is a fairly weak, surface-level approach that offers little to no edge.
For example, it’s not uncommon for newer traders to pick an indicator (like MACD) and automatically buy on every “oversold” reading and sell on every “overbought” reading. But this is nowhere close to a comprehensive strategy/system/methodology.
Top-Rated Volume Profile Training & Mentorship Programs: |
TRADE WITH PROFILE PATHWAY:
|LEARN MORE ABOUT JOSH SCHULER & TRADE WITH PROFILE| |
TRADACC PROFILE METHOD:
|LEARN MORE ABOUT AARON KORBS & TRADACC| |


In my opinion, there are 3 core components that constitute a good trade and overall methodology. It starts with a strong narrative read, then a repeatable playbook trade setup layered within that, and is backed by short-term order flow for entry.
This is how you stack the odds in your favor – through a robust, comprehensive process backed by powerful tools and personal skill. Not enough developing traders expend the effort to generate a high-level of competence and skill around these 3 elements.
But this competence and skill (especially when built around AMT & profiling) is the source of real confidence, consistency, and edge.
The Million-Dollar Question: Does Volume Profile Actually “Work”?
I don’t mean any disrespect to anyone, but I personally think this is a silly question. Because it’s kind of like asking if a measuring tape “works”. It largely depends on whether or not the tool is being applied correctly by the user.
When it comes to trading tools/indicators to choose from, there are numerous options – and I personally believe volume & market profile to be in the upper echelon in terms of quality. These tools offer incredible insights and profit-potential.
But as the trader, you still need to build competence and skill around the application of them in order to unlock that potential. Just like we discussed in the last section, no indicator is all that effective when turned into a surface-level “buy here, sell here” system.
Markets are dynamic, ever-evolving systems. So fixed/rigid systems don’t work sustainably. And since markets change, it necessitates having the competence and skill to evolve with them. Edge is not a static thing; it’s constantly shifting.
This is the strength of profiling tools. They allow you to effectively organize & analyze market structure/context/posture from the top-down (higher timeframe to lower timeframe) – and develop a robust methodology around that information & analysis.
It’s no coincidence to me that all of the best traders I’ve come across implement methodologies rooted in AMT & profiling.
Written by Matt Thomas (@MattThomasTP)
About TradingParadigm.com
Intro Trading Success Framework Course
Related Pages:
- Training For Day Trading – What is Training For Trading?
- Best Futures Trading Indicators – The Top 2 on My Charts
- Best Futures Trading Method – The Volume Profile Method
- Molding Your Market Framework – How Do You View Markets?
- How to Properly Track Your Trades to Figure Out What Works

thanks for info.
I agree with you that volume profile is one of the best trading tools/indicators available. It’s a powerful way to visualize market participation and can help you identify key levels of support and resistance. I also think it’s a mistake for beginners to overlook volume profiles in favor of other, more conventional tools.I’m glad you included examples of daily, composite, and volume imprints. These are all great ways to use volume profiles to gain different insights into the market. I’m also a fan of pairing volume profile with delta, as you mentioned. This can help you identify short-term order flow and get a better sense of where the market is headed.Overall, this article is an incredible resource that provides a comprehensive overview of the volume profile. I would definitely recommend it to anyone who is interested in learning more about this powerful tool.
Hi Jeffrey – I appreciate the kind words!
Obviously, I’m a huge fan of volume profile (and profiling in general: both volume & market profile). But it’s nice to hear from others who feel the same way about the power of these tools. I think a lot of traders either don’t know about profiling or are intimidated by it because it’s not the typical/conventional “technical analysis” that gets taught out there. There’s so much out there covering price action, candlestick patterns, and basic indicators. But, in my opinion, all of that is surface-level in comparison to profiling. I’m not saying these other things are entirely bad or ineffective; they can certainly be useful. But a far more powerful way to view and analyze markets is through profiling.
Thanks for introducing me to volume profile! It’s very useful for people like me who want to be truly educated in trading and market behavior at a deep level; especially because I intend to take my trading much more serious very soon. I don’t really understand why anyone would say it doesn’t work. It’s just like most everything else in trading: you must have a strategy and apply it and learn from the feedback and adapt before saying if it works or not.
I Angel – appreciate your input!
I think people tend to ask: “does [insert indicator] work?” because their idea of trading is flawed. And I don’t mean any disrespect by this because I was a beginner at one point who originally had the same flawed ideas and tried to turn every indicator I came across into some automatic, cookie-cutter “buy here, sell here” surface-level system. But the reality is that what “works” and “doesn’t work” is highly dependent on market context. And also highly dependent on the skill & experience-level of the individual trader. Do I think there are trading tools/indicators that are better than others (or at least resonate with me individually far deeper than others)? Yes (volume/market profile & VWAP are superior tools in my eyes). But that doesn’t mean they’re some sort of holy-grail. No matter the trading tools/indicators a trader uses, what’s most important is training to build skill & experience around those tools, tracking & journaling to understand when it works and doesn’t, and regular periods of review to continuously improve and adapt, if necessary. That feedback loop of deliberate practice, live implementation, tracking/journaling, review, and improvement/adaptation is way more important than the specific tools/indicators chosen.
There is a lot of information here and it’s something that I needed to read and watch a few times to thoroughly take in. But I think you have done a really good job in explaining the power of volume profile here. I’ve never seen anything this comprehensive anywhere else. I think that if I took the training component you continue to mention throughout most of your articles and videos seriously, then I could really learn a lot. The trading I did before was crypto trading and I am also trying to learn forex trading as well, but this whole profile trading methodology looks like something that would be a lot of fun and effective to learn.
Hi Leonard – I appreciate the kind words and I’m glad you found value in this post/video!
I talk about profiling (and especially volume profile) a lot because, in my opinion, it’s the most powerful lens to view market movement/behavior through. It’s not some sort of “magical formula” or “holy grail” or anything like that, but no other trading indicators or charting studies have ever resonated with me as much as volume & market profile (and I’ve used/tested a lot of them over the years). I think profiling is most popular and best applied within futures because of their superiority in regard to liquidity, transparency, regulation, etc. But profiling tools can be applied to every market/instrument with accurate price, volume, and time data.
Thank you for this information! I’ve done trading before, but nothing like this. This is very interesting to learn.
Thank you for this.
This was extremely informative for me. It was good to be able to read in-depth what each volume profile image was supposed to represent and how to potentially use it in regard to composites and imprints. I am curious as to what made you decide to get into volume profile work? It definitely doesn’t seem to be an easy subject to come across. I’ve been trading and never really heard of it until now.
Hi Liz – I’m glad you found this helpful!
Great question about what made me decide to pursue volume profile trading. Just for a quick summary of my experiences, I got into trading through penny stock alert/signal services. And the way most people use these types of services is to essentially just blindly follow what some “guru” says. Over the course of a couple years doing this, I realized this wasn’t going to work. It just wasn’t sustainable at all to rely on somebody else for trade ideas. So I decided to develop my own competence & skill by learning about all sorts of “conventional” technical analysis – like candlesticks, RSI, MACD, etc. (all the typical things new traders tend to come across). I did find some success with these things, especially once I paired it with a really strong mindset/psychology. But at this point, I was 5 or 6 years into my trading journey and my yearly results weren’t much better than what could be achieved through a passive investing approach. So I had to question what I was doing and came to the conclusion that it wasn’t worth the time, energy, and focus I was putting into active trading unless something changed. That’s when I started researching different methodologies and finally came across auction market theory & profiling – and it’s been an absolute game-changer. It just resonated so deeply with me and I’m not sure if I would still be actively trading without it. And to be honest, I don’t really understand why more developing traders don’t take advantage of learning and building skill around profiling tools (both volume & market profile). They display market interest/participation (aka behavior) in the most pure, powerful way that no other indicators/charting studies can match. It’s something I wish I had come across years earlier, so hopefully I can help save some developing traders a whole lot of time, energy, and money by making them aware of it.
Take care!
Thanks for all this info! I started investing on my own not so long ago and I was wondering if I need to target only one strategy or is it possible to diversify and learn more about the stock market as a whole? I personally am more attracted towards long term dividend income, what do you think about this optic?
Hi Oliver – great questions.
This is kind of a nuanced topic and there’s certainly a degree of personal preference that goes into it. But first things first, I think it’s important to differentiate between active short-term trading and passive long-term investing. A lot of the time, the terms “trading” and “investing” are used synonymously. But active short-term trading and passive long-term investing are two very different things. Of course there’s some overlap between them. But the content of this site, for example, leans more heavily toward the active short-term trading side. Generally speaking, active trading is more focused on technical analysis (price patterns & indicators on charts), while passive investing is more focused on fundamental analysis (macroeconomic factors, income statement & balance sheet data, etc.).
Just to give you an example, I personally do both: active trading AND passive investing. For me, active trading is my full-time job for weekly/monthly income. It requires daily prep & review work from both an edge/methodology & mindset/psychology perspective. A lot of my time, energy, and focus goes into it. What I do for passive investing, on the other hand, requires almost none of my time, energy, and focus (basically just some quarterly/yearly check-ins), and is more about wealth creation as opposed to producing active income. My long-term investing approach is very simple and largely involves buying-and-holding index funds and ETFs (for at least 1 year, if not much longer). Index funds & ETFs are inherently diversified because they track a “basket” of assets. So overall, my long-term investing portfolio consists of various market/sector/commodity index funds and ETFs. I spend little to no time trying to pick individual stocks that I think will “beat the market” in the long-term. There are certainly investors out there who take a more active approach in choosing individual stocks and have success doing it. But I don’t personally want much of my mental energy going into that sort of thing. It requires a large amount of money to long-term invest for a living (I’d say a minimum of $1 million) and the feedback loop (from making the investment to exiting it) is so extended that it’s extremely difficult to learn/evolve from a decision-making perspective. With active trading (assuming you know what you’re doing as a competent, skilled market participant), much larger percentage returns can be made as opposed to passive investing. And it’s not out of the question for much larger dollar returns to be made using far less capital thanks to leveraged instruments like options and futures. The feedback loop for growth and development is also much faster and more frequent when you’re getting reps/trades in every day, regularly tracking & reviewing, and adjusting over time.
To touch on your question about diversifying and/or targeting only one “strategy” – again, I think it depends on whether you’re talking about active short-term trading or passive long-term investing. I definitely think it’s a good idea to diversify when it comes to passive long-term investing – there’s a lot of wisdom in that. But in regard to active short-term trading, you have to be careful not to spread yourself too thin (especially as a beginner). The best way to go about it, in my opinion, is to start by following/testing out several different markets/instruments/timeframes/strategies that you feel like you might be interested in (either in sim/demo or extremely small scale); this is the “discovery” phase. But pretty quickly after that, you want to hone in on something really specific and build a high degree of competence & skill around it. Because being a specialist is far more rewarding than being a generalist. And the great thing about markets (especially ones with high liquidity) is that once you develop confidence and consistency in your approach (backed by real skill and historical performance), all you have to do to make more money is scale-up (aka increase your position size). If you achieve consistency with 1 futures contract, for example, you can double your profits by increasing to 2 and doing the same thing (or tripling by increasing to 3 and doing the same thing, and so on). Of course there’s going to be a mental component to overcome with scaling up because of larger swings in the account. But when it’s done incrementally, it’s much easier. I think most people are attracted to the generalist approach because it makes them feel better – like they “know” a lot about markets and can have discussions with family & friends at parties and sound “intelligent”. But the generalist approach is a trap; active trading is all about specialization. Primarily, I only trade 1 market (futures), 1 product (ES/e-mini S&P 500), 1 timeframe (intraday), using 1 overarching methodology (rooted in auction market theory & profiling), with only a handful of playbook setups/strategies – and there’s no real need to expand things out further. This provides plenty of opportunity for me on a daily basis and I’m not sure if I’ll ever scale-up to a point where I “outgrow” it. Maybe I’ll add a few more setups to my playbook as time goes on and branch out to 1 or 2 more markets/products, but it’s just not all that necessary.
I hope this helped provide some clarification. If you have any follow-up comments or questions, let me know. Take care!