What is Auction Market Theory – Trading With Auction Market Theory as a Framework:
Auction market theory is a framework based in the notion that financial markets are giant auction mechanisms.
They exist to continuously facilitate 2-way trade between buyers and sellers. When buyers are more aggressive than sellers – price goes up. When sellers are more aggressive than buyers – price goes down. When they’re relatively even, price is stable.
When you look at a chart, this helps explain market dynamics (how price moves from one area to the next). There are essentially only one of two modes that a market can be in at any given time – balance (horizontal development) or imbalance (vertical development).
When a market is in balance, buyers and sellers are in agreement on price – so a lot of time is spent and shares/contracts traded within a shallow price range. In essence, the trading opportunities lie in the breakouts from balance or reversions back to balance.
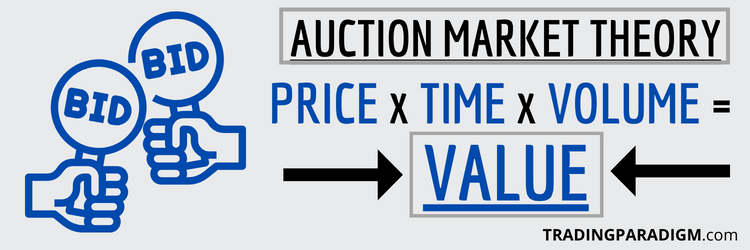
This brings up a critical element of auction market theory – price is not the same as value. Many market participants get enamored by price – which can easily fool you. Value, on the other hand, is multi-dimensional – consisting of price, time, and volume.
PRICE → Advertises Opportunity
TIME → Regulates Opportunity
VOLUME → Shows Participation
Price is just one piece to the puzzle – it’s merely an advertising mechanism. But value is revealed at levels where market participants spend the most time and do the most volume. Time at price and volume at price are critical pieces of market-generated information.
Every Market Can Be Viewed as an Auction – Housing/Real Estate Market Example:
The main benefit of understanding auction market theory is that it removes the mysticism behind how markets work. Without it, price movements can seem extremely random and chaotic. But an auction market framework can bring quite a bit of clarity.
As a hypothetical example, let’s say there’s a 4-bedroom, 2-bathroom house currently on the market for $350,000. And if you look at recent home sales in the area (the “comps”), $350,000 is right around the price where all comparable homes have sold/closed.
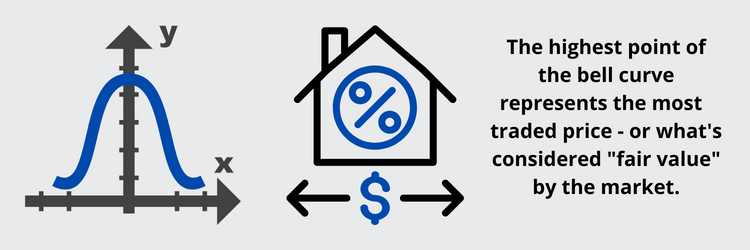
In other words, the listing price is “fair”. The market has established value for 4-bedroom, 2-bathroom houses at a price of $350,000. So what happens if a seller lists one for $400,000? Buyers will probably be reluctant/unwilling to buy at that level.
And what happens with the opposite – if a seller lists one for sale at $300,000, for example? Buyers will probably get aggressive putting in bids between the $300,000 to $350,000 range. The end result is a distribution curve where the most sales take place near “value”.
But value doesn’t remain static over time. New information enters markets and things can shift on a dime. What if, for example, there was an issue with the foundation of the house? The market will go into price discovery mode far below $350,000.
But wait – it turns out there was no issue with the foundation after all – and guess what happens? The market reverts right back to the old area of established value (~$350,000) – where the most transactions for similar homes have taken place.
What is Volume Profile – Trading With Volume Profile as a Tool (Volume at Price):
This dynamic of shifting from balance to imbalance, back to balance, and then imbalance again (repeating itself over-and-over) can be seen in all markets – and volume profile is a powerful tool for exposing where the market has developed/is developing value.
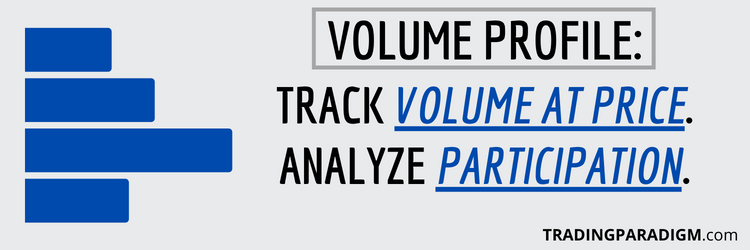
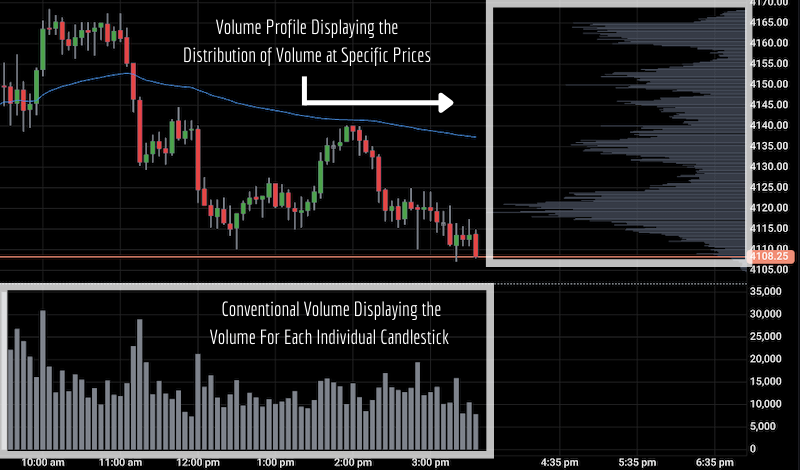
Volume profile is a histogram that displays volume at price. A conventional line, bar, or candlestick chart, for example, will typically display volume over time. But volume profile provides a deeper look inside the lines, bars, or candles for volume at price.
In essence, volume profile is an incredible tool for observing and interpreting critical market-generated information. It validates participation at specific price levels – revealing where market participants are less/more willing to do business.
Areas where a lot of buyers and sellers have come together in the past to transact shares/contracts can become quite strong – and are often characterized by consolidation (sideways movement). Price doesn’t often break through these levels very quickly.
The bottom line is that certain prices are a lot more meaningful than others – and you can’t always see these significant levels by looking at price from a one-dimensional perspective. Volume profile offers an extra dimension to price-volume analysis.
Price alone is hard to interpret, but viewing price in relation to volume provides clear “evidence” for weak/strong levels.
What is Market Profile – Trading With Market Profile as a Tool (Time at Price):
Market profile – similar to volume profile – is yet another tool used to organize and interpret critical market-generated information.
Market profile and volume profile aren’t exactly the same, but they’re often used in conjunction with one another by those who base their market methodology in auction market theory. There’s quite a bit of overlap/correlation between the two.
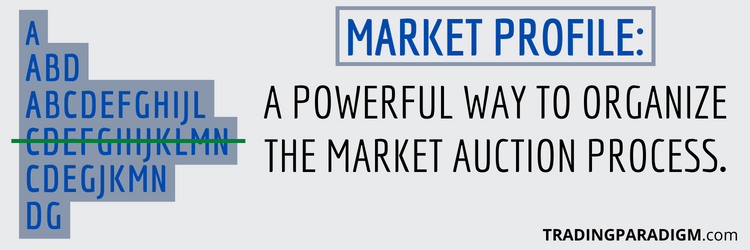
While volume profile measures volume at price, market profile measures time (or opportunity) at price. If you’ve ever heard the term “time-price opportunity” or “TPO” – it’s the same thing as market profile. It reveals more structure than conventional charts.
Market profile is often constructed using 30-minute time increments – with letters differentiating each 30-minute interval throughout the session (first 30 minutes is “A” period, second 30 minutes is “B” period, third 30 minutes is “C” period, etc.).
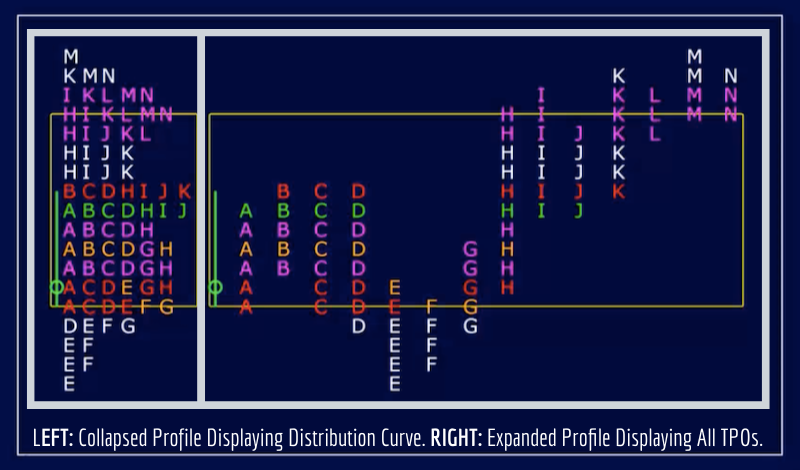
But these intervals can be adjusted to suit your individual trading needs and preferences – and also depends on the capabilities of your particular trading software. The gold standard in market profile and volume analytics software is WindoTrader Blue.
Overall, market profile is a unique way of organizing auction data generated by the market. It’s an evolving database that helps track and analyze past, current, and developing areas of value/balance. In my opinion, it’s a tool for making better trading decisions.
Putting it All Together – Auction Market Theory, Volume Profile, and Market Profile:
Auction market theory and the typical volume/market profiling tools often used to support it are not trading systems by themselves.
#1 Training Program For Developing Real Market Edge → PROFILE TRADING DEVELOPMENT PATHWAY
Auction market theory is simply a framework – a way of viewing how markets move from one area to the next. For me, viewing markets any other way feels too random, chaotic, and confusing – like something is missing. So it just makes the most sense to me.
And volume profile and market profile are tools used to organize and prioritize relevant market-generated information in regard to value (volume at price and time at price). But these tools don’t automatically spit out “buy” and “sell” signals.
They allow you to think about markets from a logical perspective (the supply & demand principles, participants involved, buyers/sellers trapped in certain situations, etc.). Then as an individual trader, you have to develop your own strategies based on this context.
Certain traders have similar styles, but everyone has to create their own “playbook” of trades based on the markets, instruments, and time frames they choose – as well as their own individual schedule, account size, risk tolerance, and other preferences.
In my experience, one of the best training programs for connecting these dots – from overall auction market framework, to volume and market profiling tools, all the way down to specific trading plans/setups is Trade With Profile.
Nobody has a magical indicator or foolproof system that you can blindly follow for never-ending profits. Trading just doesn’t work like that. You actually have to learn how to trade and build legitimate skills for long-lasting, sustainable success.
Learn More in the Trading Success Framework Course
Written by Matt Thomas (@MattThomasTP)
Related Pages:
- What is Market Profile – Trading With Market Profile
- What is Volume Profile – Trading With Volume Profile
- Molding Your Market Framework – How Do You View Markets?
- How to Properly Track Your Trades to Figure Out What Works
- Trade With Profile Review – What is Trade With Profile?

This article is an eye opener for me.
It explains in a very simple way about the auction market. One can visualize the market better if you consider time, price and volume. I see how this can help beginners better understand how the market works.
While it does not offer any guarantees for being a successful trader but it explains a lot not to lose your mental clarity in the chaotic market. Personally this article helped me a lot to understand the market better.
Does one consider the history of the price volume – chart to guide your trading judgement? Are there software to visualize the the volume transferred in every minute? It may help day trading taking action on real time.
There are never any guarantees when it comes to trading. Markets are dynamic, ever-evolving systems – so you have to be able to properly adapt as a trader. This is why things like mindset journaling and tracking trades are so important. But since these tasks aren’t all that exciting, they often get ignored/overlooked. In general, people are far more attracted to “foolproof” patterns/setups, “guru” alerts/signals, and other nonsense like that because it sounds so easy (promising massive rewards for little to no work). But all of that is just advertising/marketing in order to sell you something – it’s not how good trading actually works. Good trading requires personal mindset and behavior change through legitimate education and training – which, unfortunately, most people aren’t all that interested in actually doing.
To answer your questions, price and volume history are definitely used to guide my trading judgment. Without those two components, I don’t think I’d be able to make any meaningful trading decisions based on underlying market behavior (price vs. value). That’s really where the opportunity lies – in the divergences between price and value. The reality is that price alone can be deceiving. What makes certain price levels weak/strong is the time it spends and the volume it does there. You’ve probably seen a lot of traders on social media, for example, talk incessantly about price action, but price alone is hollow. It’s insignificant without context – and that’s where time and volume can help me paint a more accurate picture of what’s really going on underneath the surface of price. Almost all trading software will show you volume over time by default, but volume at price (volume profile) isn’t a typical default setting. My favorite tools for profiling, order flow, and time/volume analytics are Bookmap and WindoTrader Blue.