What is Market Profile – Trading Based on Time-Price Opportunity (TPO) Charts:
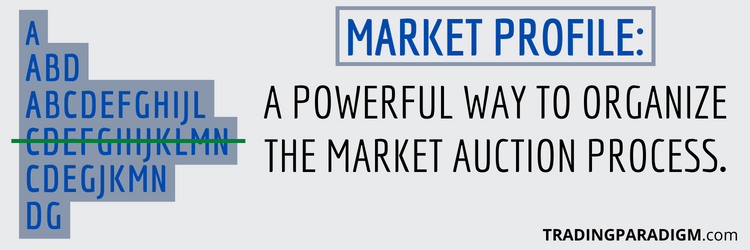
Market profile (sometimes referred to as time-price opportunity or TPO) is a unique charting method that displays time spent at price. Contrary to standard charting methods, market profile builds out a distribution curve to better showcase opportunity at price.
Market profile/TPO charts can take some time to get used to since they’re different from conventional methods (line charts, bar charts, candlestick charts, etc.). But they provide far more robust (and neatly organized) information in regard to the auction process.
When you look at a standard bar or candlestick chart, for example, you can easily see the open, high, low, and close for the time period that each bar/candle represents. But you can’t see how much time was spent at specific prices within those bars/candles.
Did price spend a disproportionate amount of time near the open, high, low, or close price? How does this relate to other price and volume references? These underlying dynamics/structures can tell you a lot about what the market is most likely to do next.
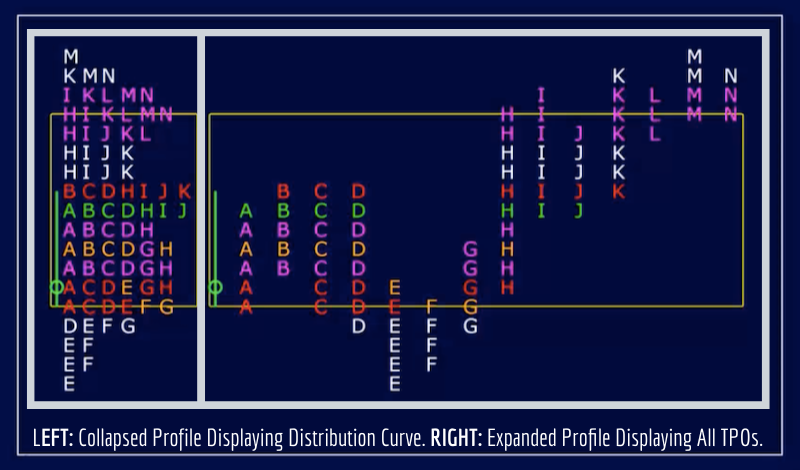
The most common approach to building out a market profile is with 30-minute increments, but this time frame can be adjusted based on your specific charting software and individual preferences. Typically, each increment of time is denoted by a specific letter.
For example, the first 30 minutes of the session are deemed “A” period, the second 30 minutes are “B” period, the third 30 minutes are “C” period, etc. Within each period, the letters print upwards as price hits new highs and downwards as price hits new lows.
Over multiple periods, market profile offers information as to where/when market participants are willing/not willing to get involved.
Market Profile vs. Volume Profile – Is Market Profile the Same as Volume Profile?
Market profile and volume profile aren’t exactly the same, but they’re often used/referenced in conjunction with one another.
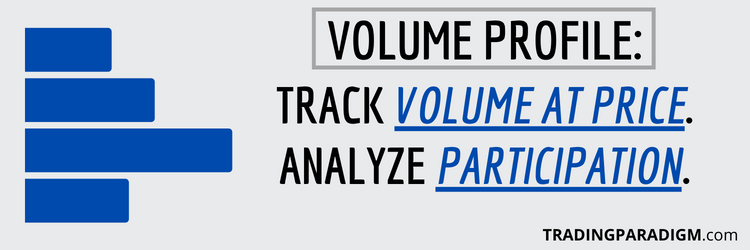
Market profile, as we’ve been detailing in this post, displays time/opportunity at price – and volume profile displays volume at price. They’re both histograms/distribution curves, but designed to display slightly different (yet correlated) information.
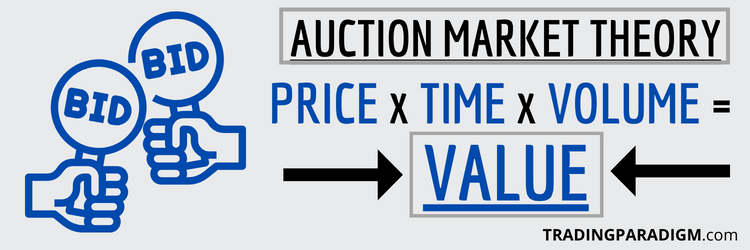
They’re correlated because the more time spent at specific prices, the more volume will be done there (generally speaking). Areas where price, time, and volume come together represent areas of relative value/balance (where buyers and sellers are willing to do business).
#1 Training Program For Developing Real Market Edge → PROFILE TRADING DEVELOPMENT PATHWAY
Just like the volume profile has a point of control (the price with the highest volume within a specified time period), the market profile has a point of control as well (the price with the longest horizontal string of letters/TPOs within a specified time period).
Analyzing volume and market profiles across multiple time frames can provide clues as to what the market as a whole is considering unfair highs/lows and value areas. These levels can then be used to characterize open types, day types, and specific trade plans.
Volume profile and market profile aren’t trading strategies on their own. But they’re powerful tools that allow you to synthesize price, time, and volume data, analyze confluent/divergent reference zones, and manage risk-reward based on market-generated information.
Develop a Deep Understanding of How Markets Move With Auction Market Theory:
I often reference the “depth” required to be a consistently profitable trader – and there’s two forms of it: 1) personal depth (the mindset/psychology/self-awareness component) and 2) market depth (the dynamics/structure/mathematical edge component).
In my personal opinion, these tools (volume profile and market profile) – which are often associated with auction market theory – provide more depth than any other trading tools or methodologies I’ve ever come across. They just make the most sense to me.
I used to trade based on cookie-cutter price patterns and indicators – as if price action was all that mattered. But I never experienced much more than moderate success that way. That’s because I was missing the power of 2 key components (volume and time).
It wasn’t that I was completely ignoring volume and time – I had just been looking at them in less effective ways. Volume and market profile have allowed me to view them both (in relation to price) in better organized, more robust ways. It’s like going from 1D to 3D.
Viewing markets as auctions and using profiling tools isn’t the only way to trade – other methodologies/tools can suffice. But in my experience, volume and market profile organize market-generated information in ways that no conventional tools can match.
The level of depth (market dynamics/structure/posture/character) that these profiling tools can help depict is significant.
Learn More in the Trading Success Framework Course
Written by Matt Thomas (@MattThomasTP)
Related Pages:
- Trade With Profile Review – What is Trade With Profile?
- What is Auction Market Theory – Trading Value vs. Price
- What is Volume Profile – Trading With Volume Profile
- How to Properly Track Your Trades to Figure Out What Works
- What is Asymmetric Risk-Reward in Trading and Investing?

