What is Volume Profile – Look Inside the Bars/Candles For Areas of Participation:
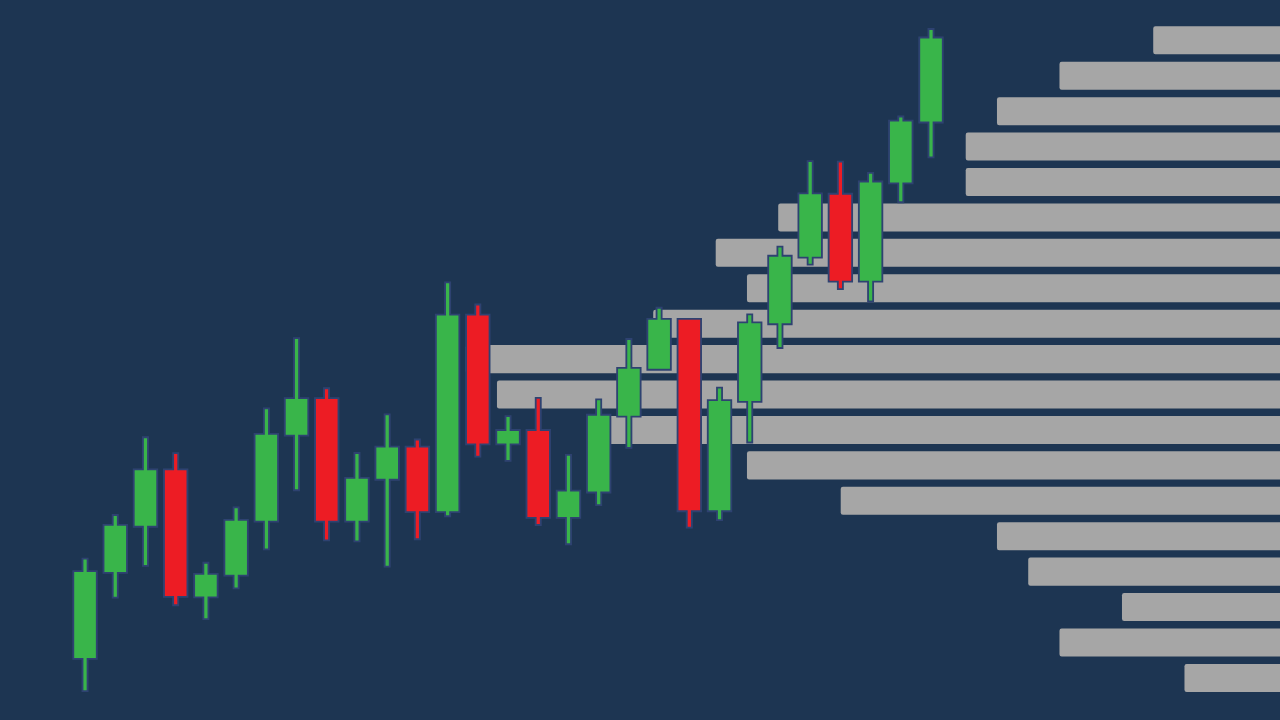
Volume profile is a powerful charting study/indicator that shows volume at price (as opposed to the conventional volume over time).
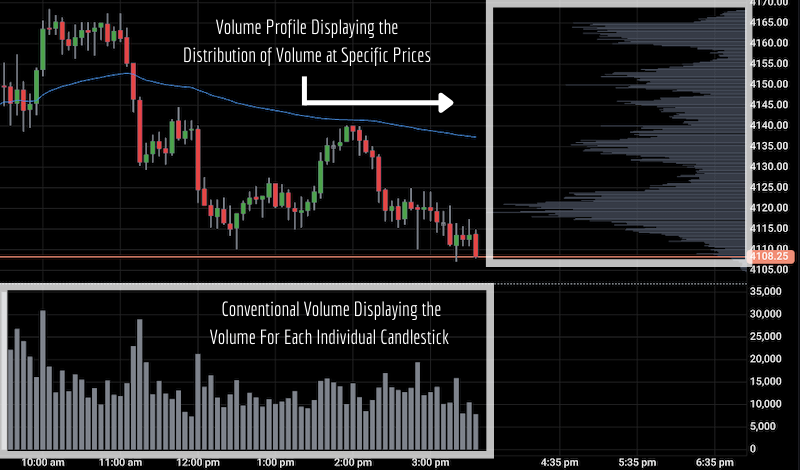
Many traders use bar charts or candlestick charts to track price action (which allow you to visualize the high, low, open, and close of a specified time period) – with volume presented below the chart (showing the volume generated for each individual bar/candle).
But volume profile provides an even deeper look into the bars/candles. Instead of only seeing how much volume was done over time, volume profile displays how much volume was done at specific prices. It tells you where the most business has taken place.
Certain prices are much more meaningful/significant than others. Prices that experience low volume (low participation) are weak and prices that experience high volume (high participation) are strong. Volume profile offers this extra dimension to volume analysis.
As a trader, knowing the price levels with the lowest/highest levels of participation can help you form proper expectations and plans. For example, you can expect that price is most likely going to move sideways or consolidate in the highest volume areas/zones.
That’s because these areas are where lots of buyers/sellers are willing to participate and agree on price. There’s relative balance in supply and demand. The price level with the most volume within a specific time period is known as the point of control.
Volume Profile vs. Market Profile – Are Volume Profile and Market Profile the Same?
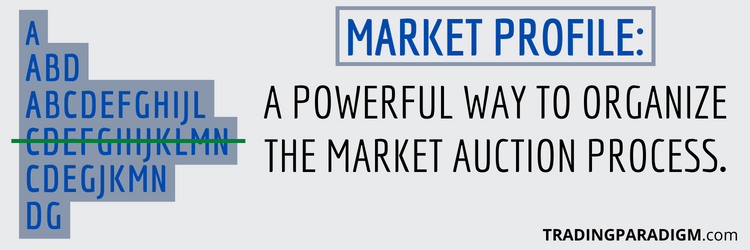
Volume profile is similar to market profile, but they’re not exactly the same. Both organize data into histograms – which provide critical market-generated information in clean, digestible ways. But the information each one provides is slightly different.
We’ve already discussed volume profile – which tracks volume at price. But market profile tracks opportunity at price – which is why market profile charts are also known as time-price opportunity (TPO) charts. So market profile charts and TPO charts are the same.
Even though volume profile and market profile are different, they’re often used in conjunction with one another – especially by those who trade based on auction market theory (with the cornerstone of auction market theory being that price and value are not the same).
Price (which advertises opportunity) is only one component of value. But value is also made up of volume (which displays strength of participation) and time (which regulates opportunity and participation). So volume and time provide more context in regard to price.
When you view the market as a continuous 2-way auction and have this 3-pronged interpretation of value – volume and market profiling methods are simply the best ways to organize key market-generated information in order to make better trading decisions.
In my opinion, these tools are unmatched when it comes to recording and analyzing auction data (in any type of market).
Trade With a Better View on Markets – Understand What’s Driving Price Movement:
Overall, what volume and market profiling provide is a more effective way of organizing data to reveal patterns in herd behavior.
I’m not discounting conventional methods of viewing markets (with bar/candlestick charts, for example), but these methods are one-dimensional. They’re much better than line charts, but they still lack in structure. They don’t expose the true character of the market.
#1 Training Program For Developing Real Market Edge → PROFILE TRADING DEVELOPMENT PATHWAY
Volume and market profile provide significantly more information in regard to the location of weak/strong price levels (areas of balance and imbalance). I often talk about “depth” in regard to market-understanding and analysis – and this is exactly what I mean.
Most traders get enamored by price, which is easy to get fooled by. But price is just an advertising mechanism. It’s only one piece of the puzzle. Analysis based on value (price, volume, and time), on the other hand, presents evidence-based support and resistance levels.
Volume and market profiling aren’t strategies in themselves – there’s more to strategy development than that. But they’re robust tools for organizing what would typically be a cumbersome amount of market data into graphically appealing distribution charts.
So if you’re looking to more precisely observe and analyze the flow of market activity, and all the nuances and complexities that go along with it, then I highly suggest looking further into volume profile, market profile, and auction market theory.
Learn More in the Trading Success Framework Course
Written by Matt Thomas (@MattThomasTP)
Related Pages:
- What is Market Profile – Trading With Market Profile
- What is Auction Market Theory – Trading Value vs. Price
- How to Properly Track Your Trades to Figure Out What Works
- What is Trade With Profile – Best Trader Training Program?
- What is a Statistical Edge in Trading – Expected Value Explained

I really enjoyed reading the “Trader Psychology” section of your website! I sometimes have the occasional temptation to just dump everything I’ve invested in back into the market so I can start from a clean slate, and this usually happens out of frustration or fear… So reading this section of your website will help me overcome this! Thank you!
No problem – I’m glad you enjoyed some of the Trader Mindset/Psychology articles and videos I’ve created. It’s an area that a lot of traders simply ignore/overlook because it’s not all that exciting in comparison to the “magical indicators”, “foolproof systems”, and “explosive alerts” that so-called “gurus” tend to talk about all the time online. But it’s so critically important to get the psychological component right. In my opinion, it’s the glue that brings everything together.
But that doesn’t mean mindset alone will produce trading success. I’ve known a lot of developing traders who thought the only thing stopping them from achieving their trading goals was their mindset/psychology (which it partly was). But in reality, the main cause of their struggle was that they didn’t have a robust market edge. The best mindset in the world won’t help a bad strategy/system/methodology miraculously work. In the end, all traders need both components (Edge & Mindset) working in conjunction with one another as a cohesive whole. Being weak/ineffective in one destroys the other.
First time i’m reading about volume profile and market profile, this is really complicated stuff, I tried to trade before with demo account, I didn’t know there are such things as volume or candle bars or market profile, what I was following is going up and down and the green and red lines. However, this is really informative, I understood some new information
Hi Moses – I appreciate you sharing your thoughts on this topic and previous experiences with trading. I’m glad you found this post to be informative.
Volume profile and market profile can definitely seem complicated at first – I can personally attest to that. I kind of pushed off looking into them myself at first because they were different. They’re not the usual charting techniques most traders turn to with bar or candlestick charts. But once I finally decided to give them a real chance, it didn’t take very long to get used to (maybe 2-3 weeks of immersion to build a nice foundation). But that type of learning curve is to be expected with anything new (at a minimum). Of course it takes much longer (months/years) to become extremely proficient/nuanced with these tools, but they’re not so “scary” once you overcome the initial “dealing with something new” phase. What these tools are doing is showing key market-generated information (price, time, and volume) and how they relate to one another in unique, more robust ways. It clues you in on areas of value that standard charting methods can’t/don’t do. Markets are complex systems, so things can certainly seem “complicated” at times, but these tools provide an in-depth look at market activity through fairly simple/elegant information graphics.
Viewing the markets through the lens of auction market theory and utilizing profiling tools to organize critical market-generated information honestly removed a fog that had been cast over my trading for years – and I’ve found that a lot of other traders who have come across these tools and implemented them into their trading approach feel the same way. Prior to them, I felt like markets were extremely chaotic/random – which they still are to some degree (there are a lot of moving parts). But the auction framework and supporting profiling tools have brought much more order/structure to the way markets move from my perspective. As a way of viewing markets and organizing/interpreting information, these things just make the most sense to me. I don’t necessarily like to push any specific market view/methodology on anybody, but it seems like far too many traders who visit my website and go through my free course lack clarity and real edge in their process – and I feel like becoming proficient in auction market theory and profiling tools might be one of the biggest missing pieces for many of them.
Thank you for your post. I first came across the term Volume Profile as i was trying to figure out markets in this crisis, and i can say your site helped a lot in explaining many other aspects of trading to me. I will be signing up for the Trading Success Framework, looks like it is something I will also need.